Monthly Leave Reporting Dashboard Guide
A monthly routine for reading BreezeLeave leave reports: utilization, coverage, approvals, country insights, and what to escalate to leadership.
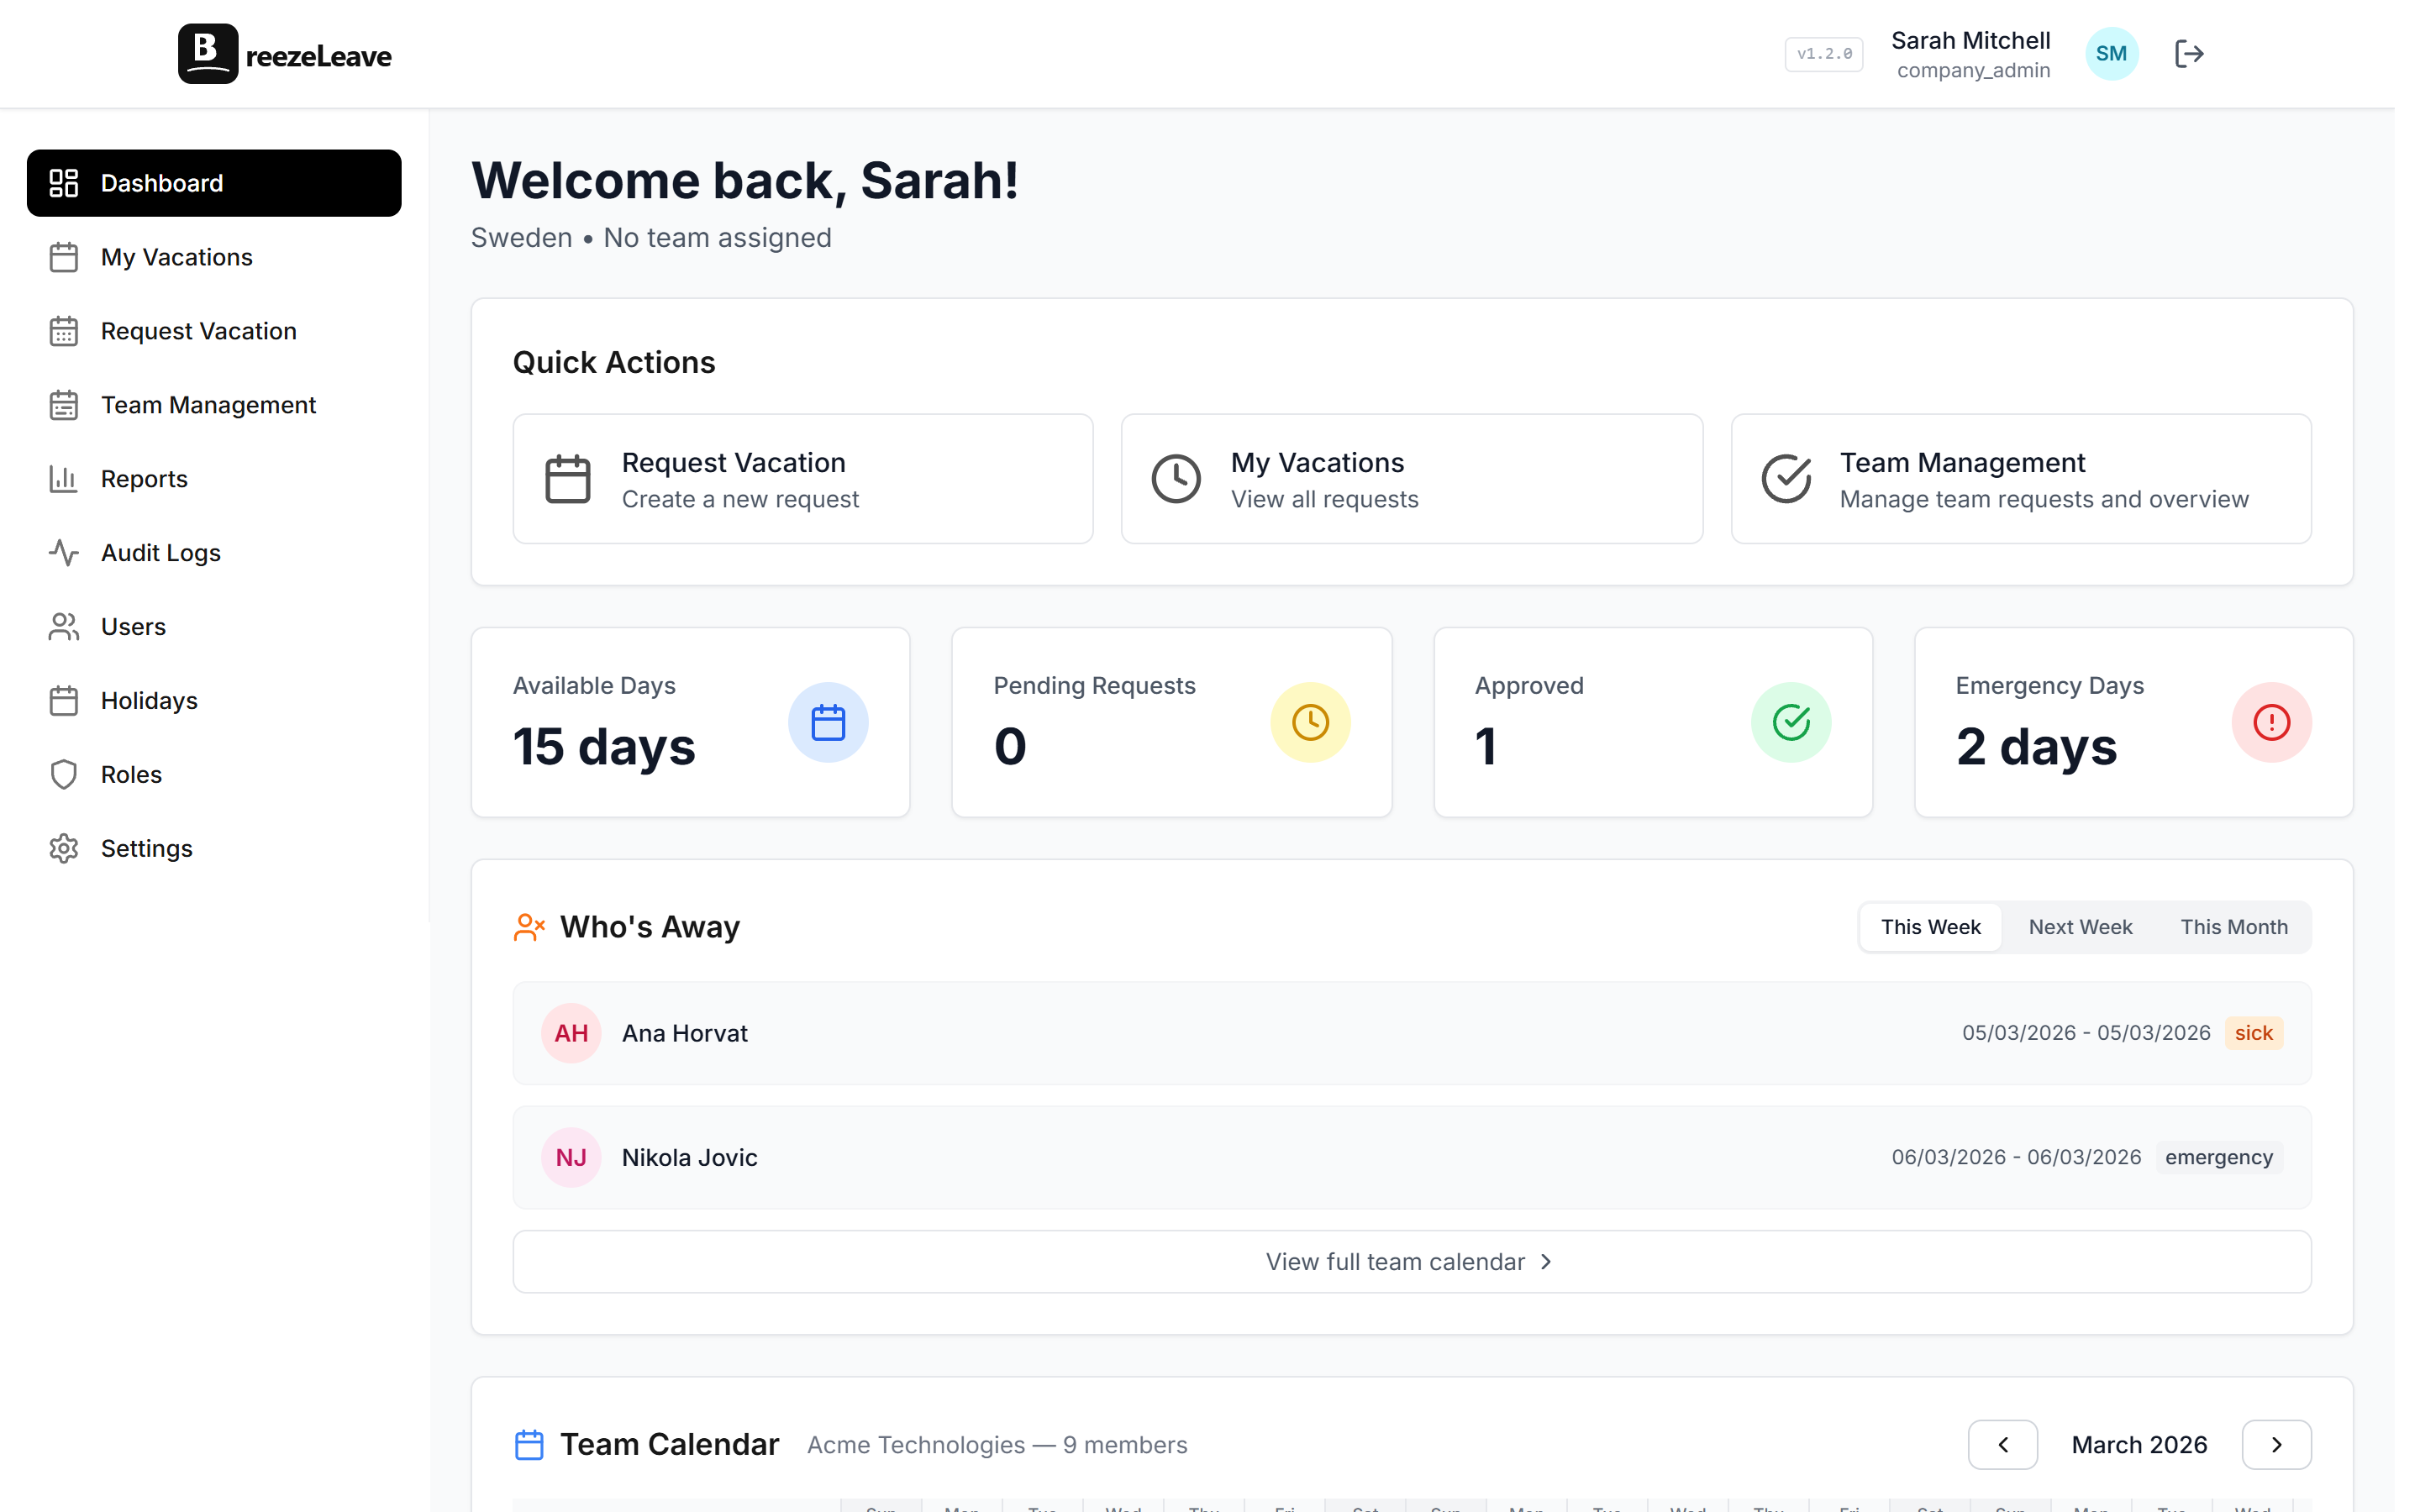
The first Monday of the month tends to land hard on HR. Payroll wants the leave numbers, leadership wants the headline, and a department head somewhere is asking why three of their people were off the same week in March. A monthly leave report answers all three if it is read in the right order. Read it the wrong way and the meeting turns into a spreadsheet rescue mission. This article lays out a 30-minute routine an HR manager can run on the first working day of every month using the BreezeLeave reports module.
The routine assumes the company already runs leave through BreezeLeave, that approvals are mostly current, and that team membership is up to date. If any of those are stale, the report will reflect the staleness, not the underlying truth.
Step zero: confirm the data is clean
Spend the first five minutes on data hygiene. Three checks catch most of the noise that would otherwise show up in the meeting.
- Pending approvals from previous months. If a request from February is still sitting in pending, it skews March utilization. Nudge the approver or escalate.
- Recent adjustments. Manual balance changes should have a documented reason. The post on vacation balance adjustments covers which categories belong in the audit log.
- Team membership. A new joiner without a team assignment lands in the unallocated bucket and disappears from team-level views.
Once the data is clean, the rest of the report reads cleanly too.
The four views to read in order
BreezeLeave reports cover five angles. For the monthly review, four of them are enough. Country insights matters only if the company operates in more than one country, which we will cover separately at the end.
| View | Question it answers | What to flag |
|---|---|---|
| Utilization | Are people taking the leave they earn? | Anyone below 30 percent through the year |
| Trends | When does leave actually happen? | Months heavier than last year by 15 percent |
| Coverage | Which teams ran thin and when? | Same team appearing thin two months in a row |
| Approvals | Where do requests sit? | Average time-to-decision above 48 hours |
Read them in this order. Utilization first because the people number is the headline. Trends second because the calendar context shapes the rest. Coverage third because that is where leadership starts asking questions. Approvals last because process issues are easier to discuss after the operational picture is clear.
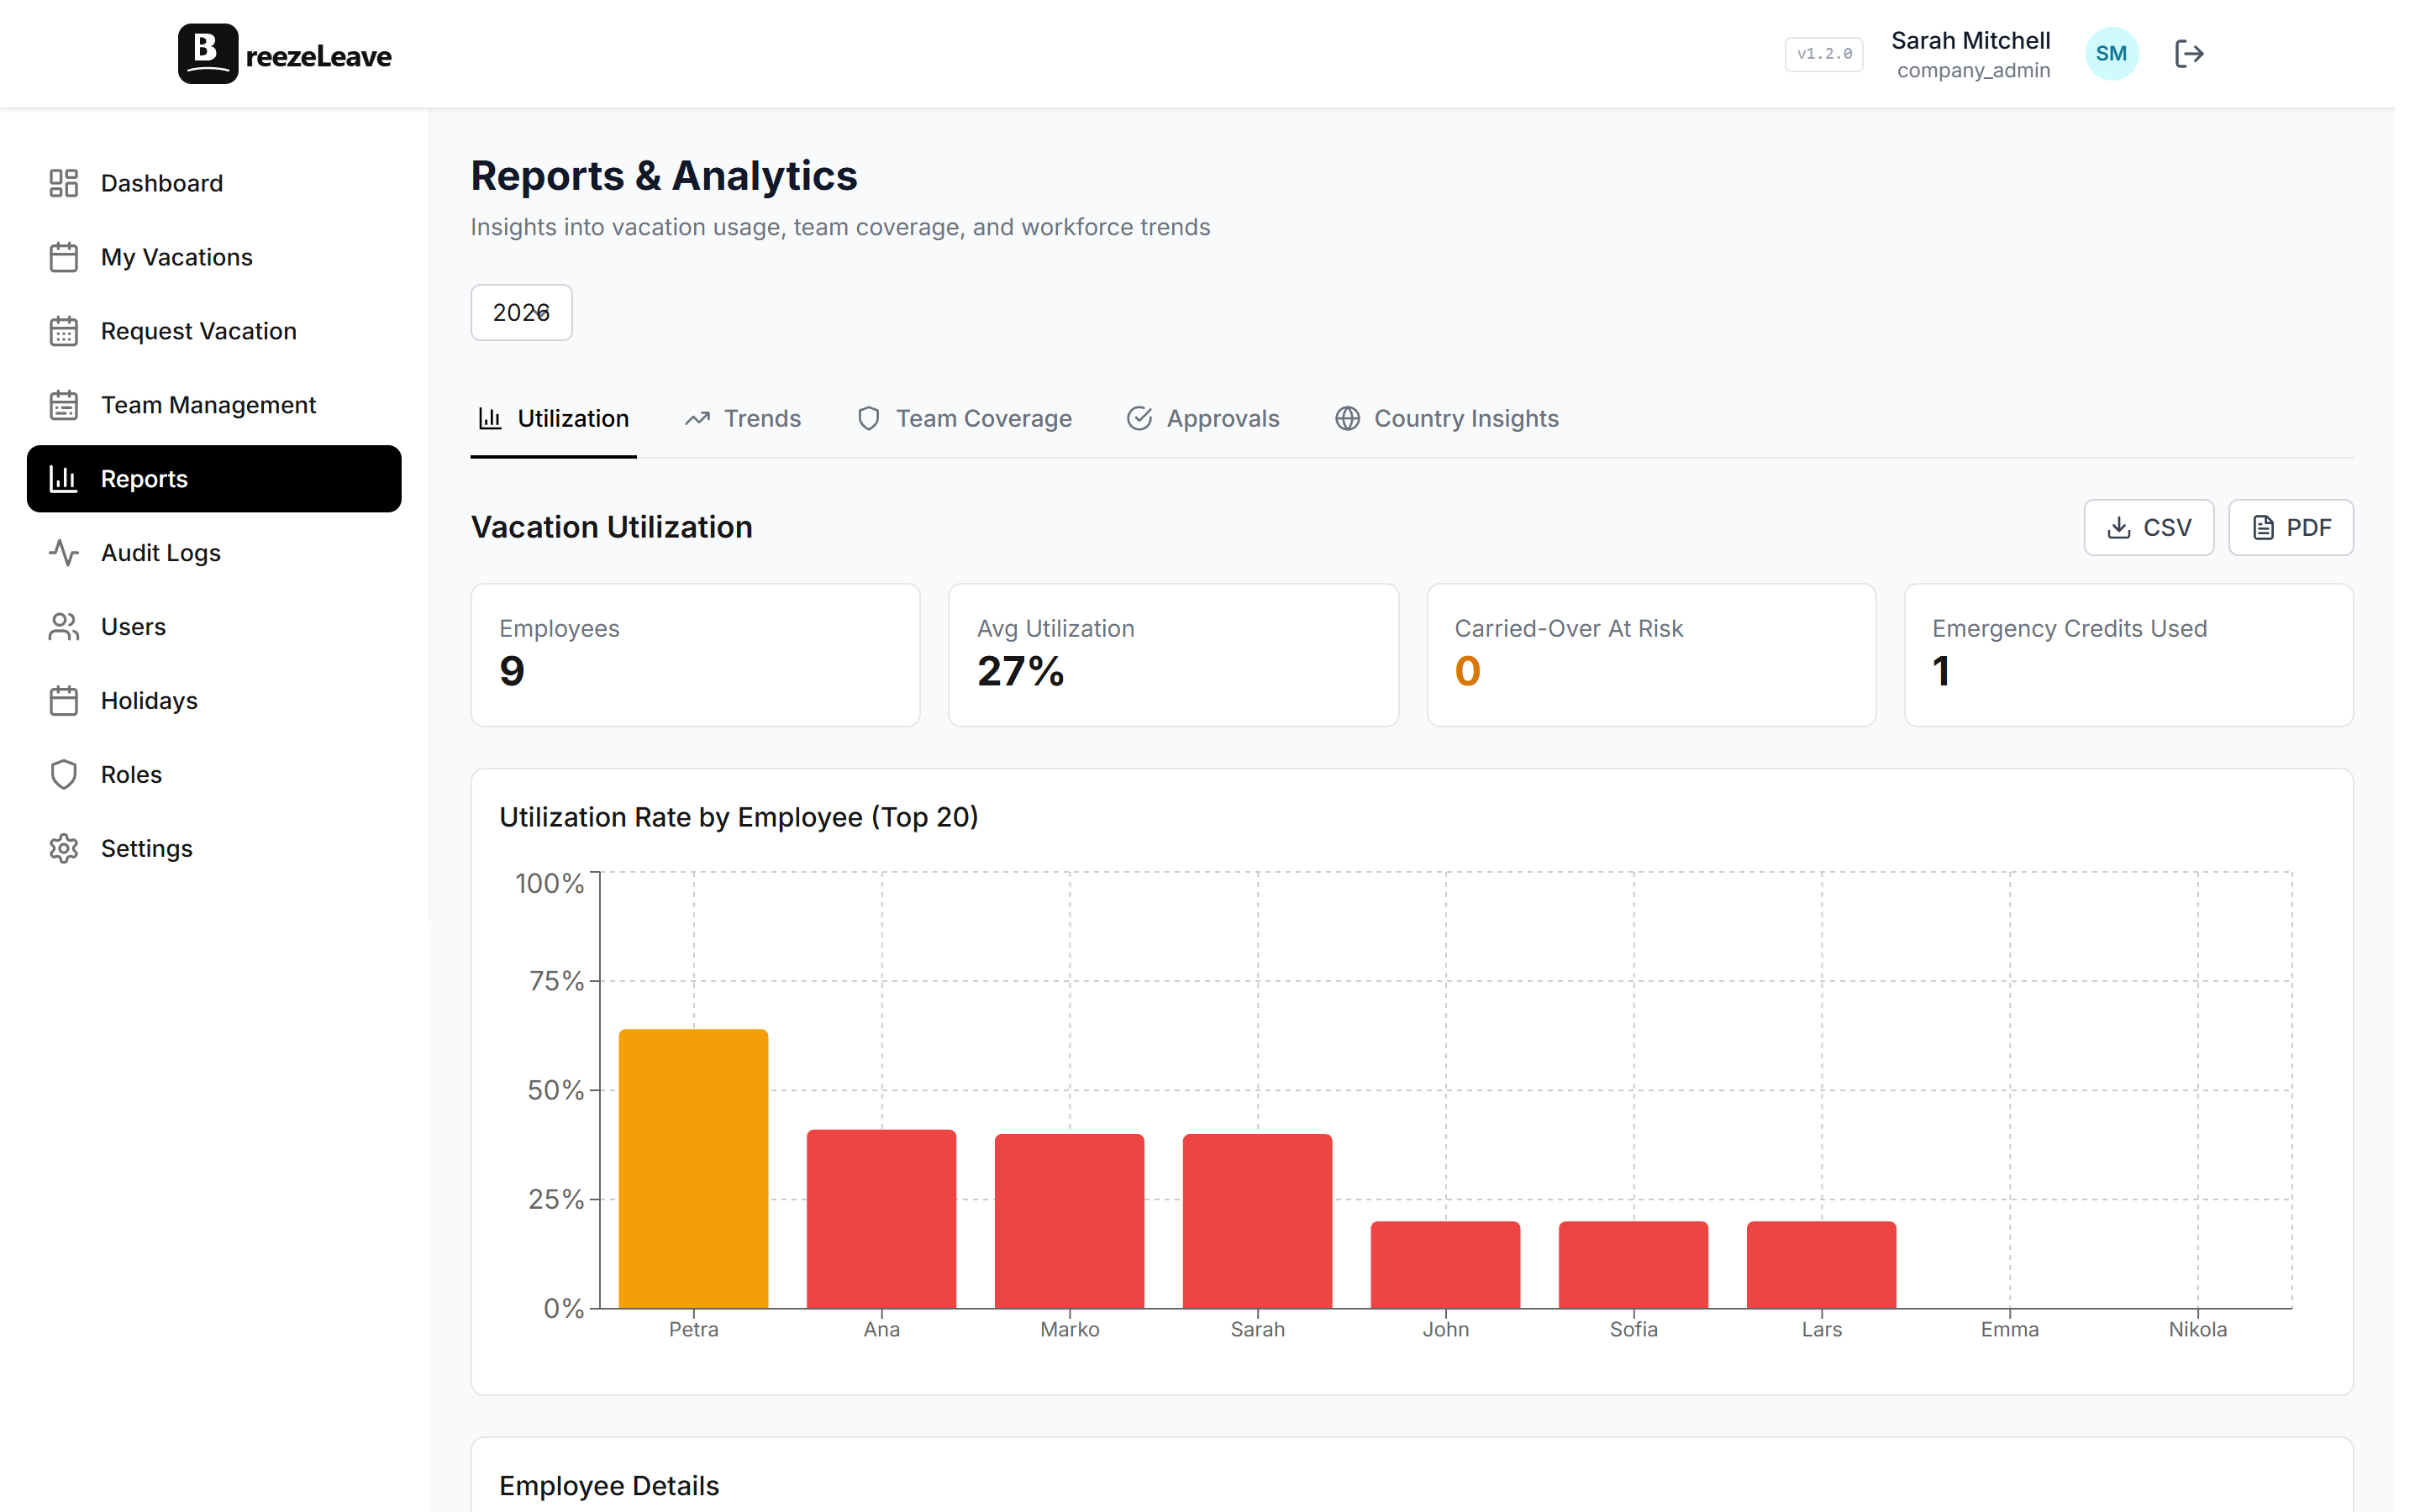
Utilization: who is not using their days
Utilization shows how much of each employee's accrued leave has been taken in the year to date. A low number is not automatically a problem. New joiners pull the average down. Parental leave does the opposite. Read it with two passes.
First pass: sort by lowest utilization. Anyone below 30 percent through the year is worth a closer look. If they joined recently, the number is fine. If they have been with the company for three years and still sit at 20 percent, something is keeping them from taking time off. Often it is a team workload pattern, sometimes it is a manager who quietly discourages leave.
Second pass: sort by highest utilization. Anyone above 90 percent in May will have nothing left for the autumn. That is fine if they wanted to front-load the year. It is a coverage risk if they did not.
The outcome of this view is usually a short list of three to five names. Hand the list to the relevant team leads with one sentence each. The goal is awareness, not intervention.
Trends: the calendar shape of the year
Trends shows leave per month over the year, broken down by leave type. Three patterns repeat:
- The summer hump. July and August dominate. If your hump is taller this year than last, coverage planning needs an earlier start.
- The December tail. The week between Christmas and New Year. Worth noting in trends because it usually does not need active management.
- The sick-leave bump. Sick leave spikes in February-March and again in October-November. Compare it month to month, not to vacation leave.
The view to share with leadership is a year-over-year comparison. "March vacation was 20 percent heavier than March last year" is a sentence a CFO can act on. The same number without context is noise.
Coverage: where teams ran thin
Coverage shows how many people from each team were off at the same time across the month. The number is contextual. A four-person engineering team with two people off the same week is a problem. A 30-person customer support team with two people off is fine.
Read the coverage view by team, not in aggregate. The interesting cells are the days when overlapping leave hit a defined coverage threshold. If your team uses concurrent absence limits, those days should be rare. If they are not, the rule and the reality have drifted apart. The blog on preventing team vacation conflicts walks through the soft and hard versions of that rule.
A common pattern: the same team shows up in coverage two months in a row. That is the signal that headcount or coverage rotation is undersized for the way the team takes leave. Bring it to the team lead with the data, not the conclusion.
Approvals: where requests stall
Approvals shows the time from request submission to decision, broken down by approver. The average is mostly meaningless. The distribution is where the story lives. One approver with a median time of three days while the rest of the company sits at six hours is the kind of pattern to address quietly.
Three categories to look at:
- Pending older than 7 days. Almost always a process gap. Either the approver is on leave, or the routing logic skipped them.
- Rejected without comment. A rejection is easier to discuss when the reason is in the audit log. The post on audit logs in leave management covers what survives staff turnover.
- Auto-approved by exception. If a request was auto-approved because no approver acted within the SLA, that should be rare. If it is common, the routing rule needs a look.
Country insights when you operate across borders
For single-country teams, skip this view. For multi-country teams it is where holidays, working-day calculations, and statutory leave types diverge. The country insights view in BreezeLeave breaks the same four metrics down by operating country.
Two questions to ask each month:
- Are utilization patterns consistent across countries? A 20 percent gap can reflect statutory differences. A 50 percent gap usually points at a policy drift somewhere.
- Do public holidays line up with the booking pattern? If everyone in Sweden books the week of Midsommar and the system shows it as a normal week, the holiday calendar is missing entries.
For deeper multi-country reading, the post on managing PTO across countries covers the policy side.
Exporting and sharing
Once the four views are read, two outputs cover the rest of the month:
- CSV export for payroll. Approved days per employee, broken down by leave type. This is the file the bookkeeping team picks up. The bookkeeping and payroll export piece walks through the columns.
- PDF export for leadership. Each view supports a PDF that can be attached to the monthly leadership note. The PDF is for context, not for action.
The same exports underpin the audit trail. Save them in a durable location so a question in October about June data has an answer that takes minutes, not days.
The 30-minute routine at a glance
- Five minutes: confirm data hygiene (pending approvals, adjustments, memberships).
- Five minutes: read utilization, list outliers.
- Five minutes: read trends, compare to last year.
- Five minutes: read coverage, flag repeat-offender teams.
- Five minutes: read approvals, list stalled requests.
- Five minutes: export CSV for payroll, PDF for leadership, save both.
After three months of running the routine, the meaningful outliers will surface earlier. Most months will need 15 minutes, not 30. The remaining time goes into the conversations the data points at.
For the full feature set behind the routine, including filters, exports, and per-team drilldowns, jump into BreezeLeave reports and analytics.