The first Monday of the quarter usually starts with the same question from the leadership team: how is leave usage tracking against plan, and which teams are running short on coverage? If the answer lives in a Google Sheet, the HR manager spends the morning copying approved requests, pivoting by team, and adjusting for public holidays before anyone gets a number they trust.
Leave reports are supposed to fix that. The Reports page in BreezeLeave gives HR managers five focused views over the same approved-leave data, with filters for date range, team, country, and leave type. It is the page you open when finance asks for the accrual snapshot, when a delivery lead wants to know if the team has summer coverage, or when you need to send a board-ready PDF that does not require explanation.
What HR managers need from leave reports
A leave reporting tool is only useful if it answers the questions a HR manager gets every month. The Reports page is built around five of them.
How are people using their PTO?
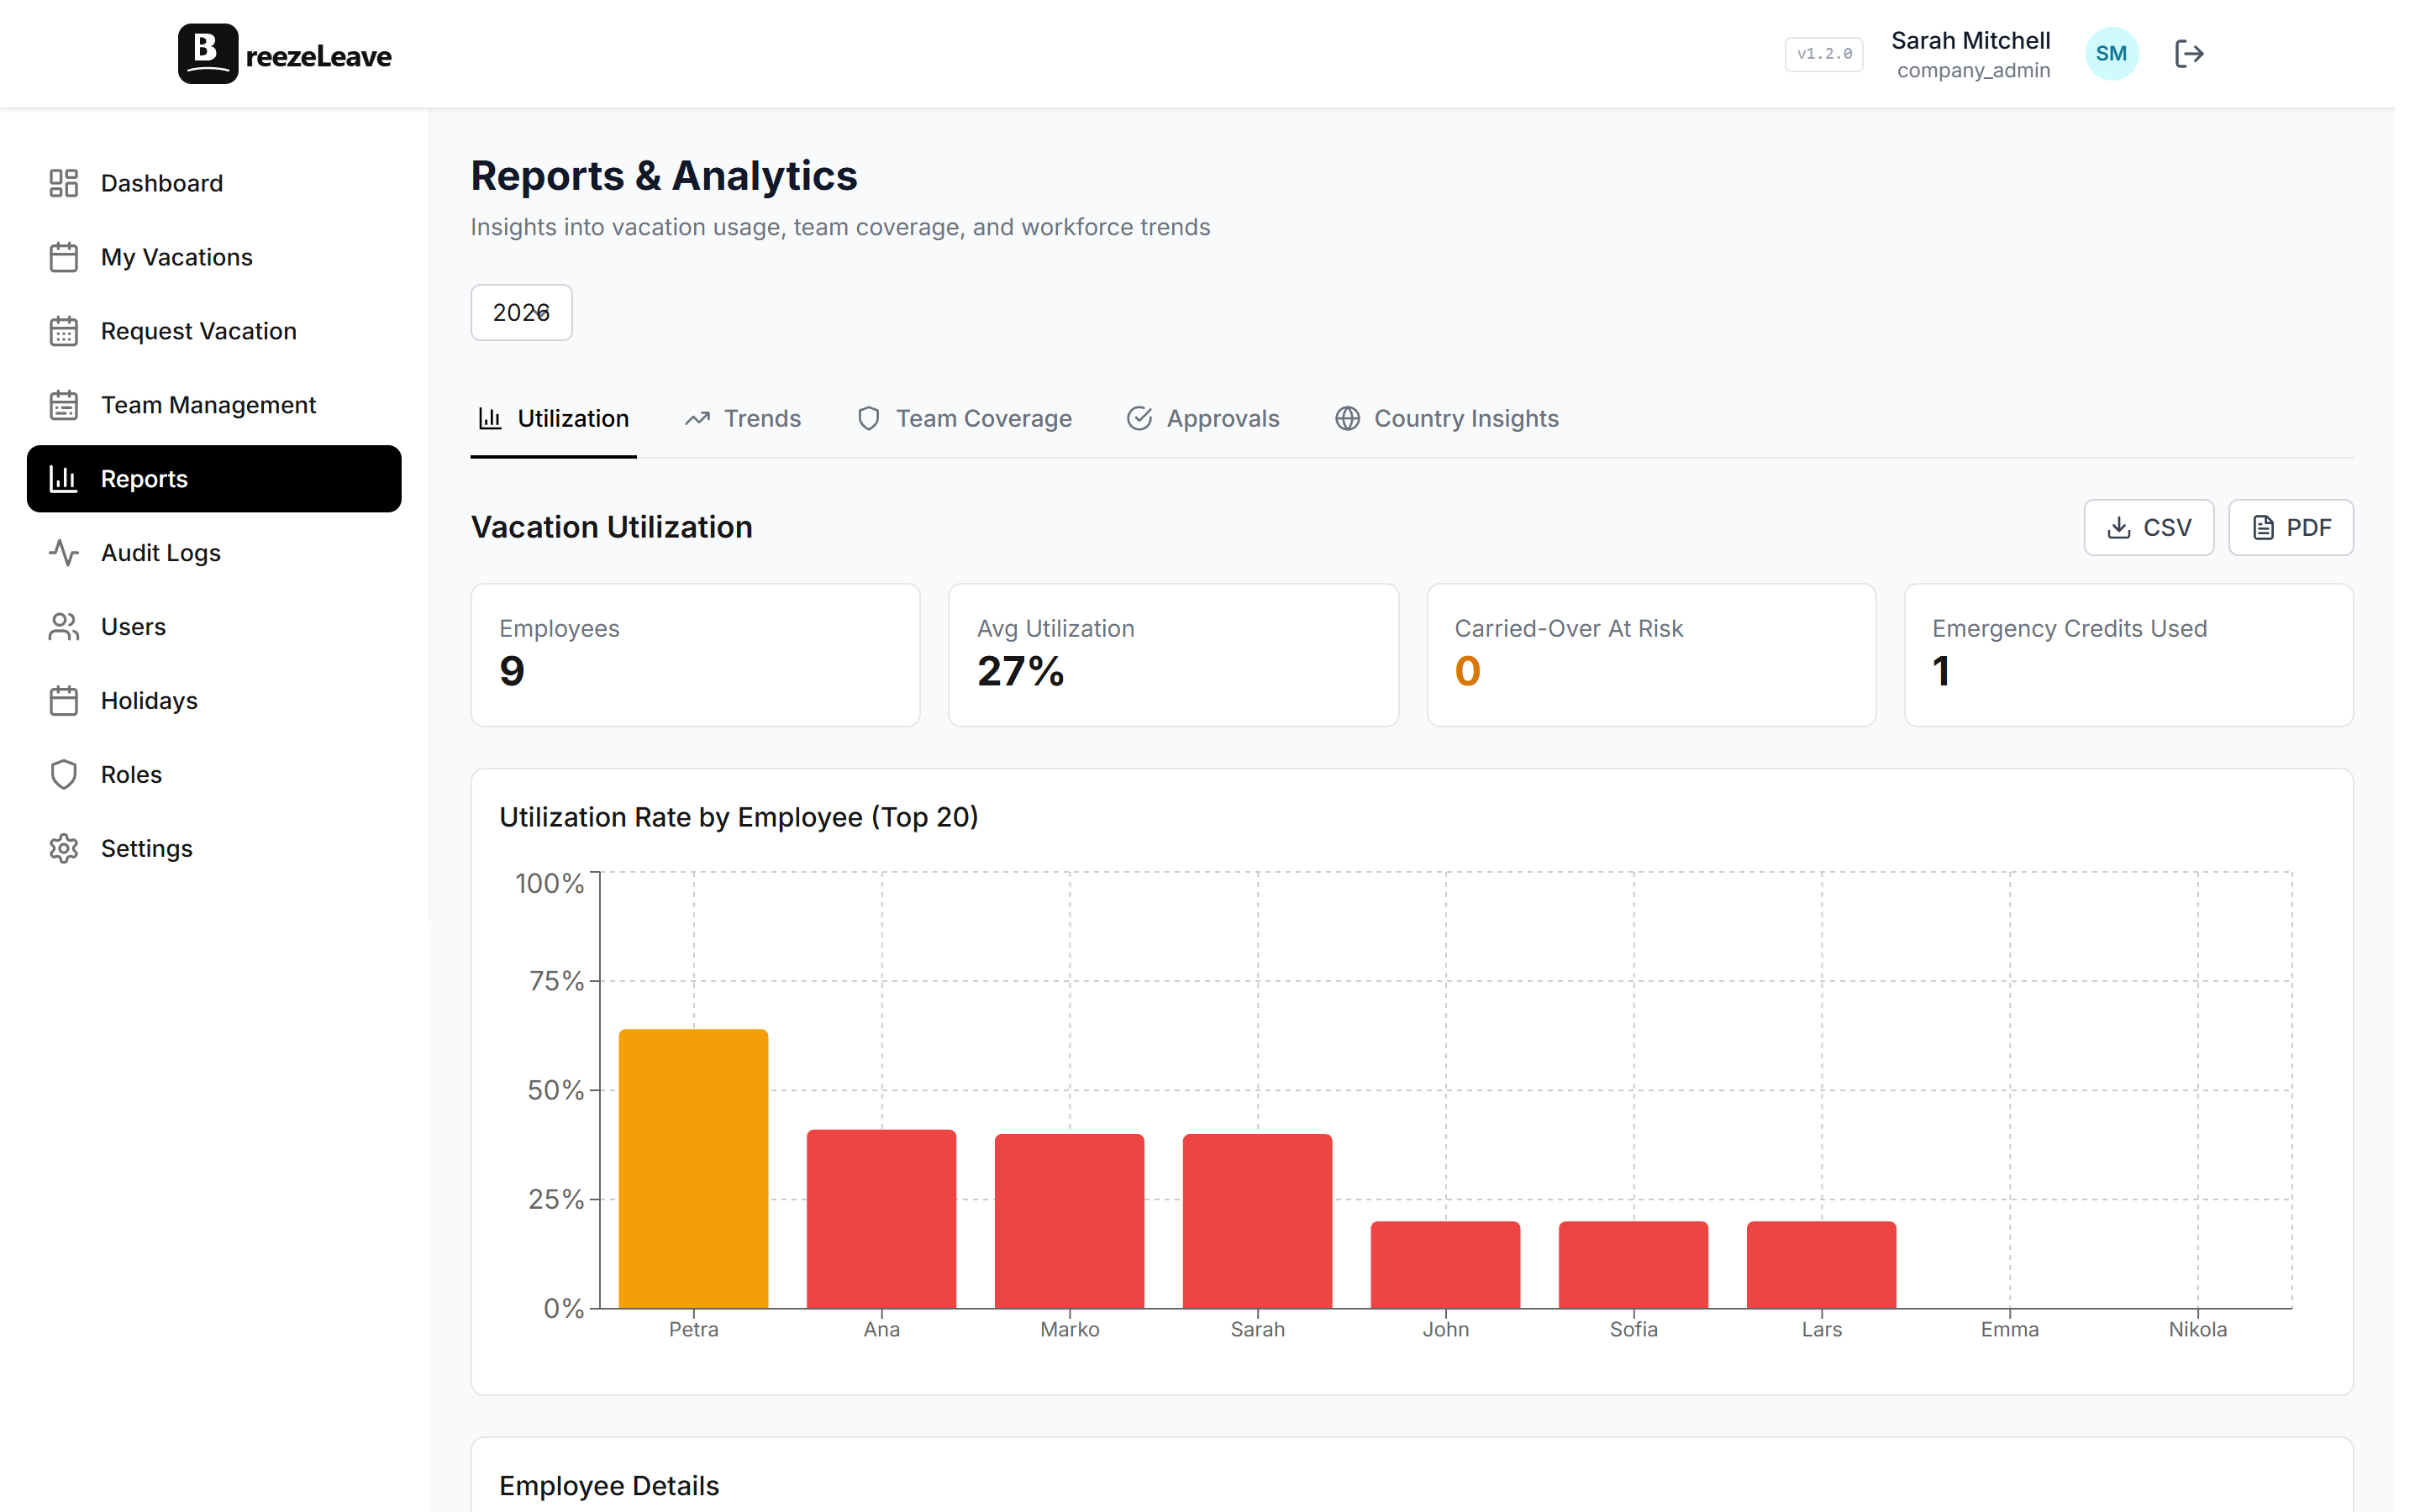
The utilization tab shows approved leave against entitled days for the filter window. You can see whether engineering is burning through allocation faster than marketing, whether new hires are taking less than expected, and whether anyone is sitting on so many unused days that carryover will be painful at year end. The metric runs on entitled days minus public holidays minus weekends, so the denominator is real working capacity.
Is the team trending up, flat, or down?
The trends tab plots leave volume over time so seasonality stops being a surprise. If your company has a heavy summer and a quiet December, the trend chart shows it on the same axis across two or three years of data. You can filter by leave type to separate vacation from sick leave and from personal days.
Does the team have coverage?
The coverage tab puts headcount, scheduled leave, and concurrent-absence counts on the same page. A team lead can scan the next four weeks and spot a gap before it turns into a delivery problem. The view is also where the conflict story lives: if three engineers from the same squad have approved leave the same week, coverage shows it on one screen, so the lead does not have to open the calendar tab by tab.
Are approvers responsive?
Approval patterns count requested, approved, rejected, and cancelled requests for each approver. If a manager has 14 outstanding requests and a 4-day average response time, you learn that before the team starts complaining. The view also shows auto-approved counts so you can tune the rules engine instead of guessing whether it is doing its job. We wrote more about that calibration in our post on how HR managers save five hours per week with the right reports.
How does each country compare?
The country tab breaks usage down per country with public holidays automatically excluded. A team in Spain with 14 public holidays does not look artificially light on PTO compared to a team in the UK with 8. Average request length, approval rate, and total requested days are visible on one row per country.
Filters that make leave reporting useful
A leave report with no filters is a wall of averages. The filter bar on the Reports page sets four scopes that apply to every tab at the same time, so when you switch from utilization to coverage, you stay on the same view of the company.
- Date range. Year to date, last quarter, last 12 months, or a custom range. Carryover and accrual periods can sit on either side of the start date and the numbers still reconcile.
- Team. Filter to a single team or compare two or three teams side by side. Useful when a delivery lead wants to know how their squad compares to the rest of engineering.
- Country. Useful when a country has different public holidays, different leave entitlements, or a separate HR business partner.
- Leave type. Separate vacation from sick leave, personal days, parental leave, and unpaid leave. Sick-leave trends usually deserve their own conversation.
Filters compose. A HR manager looking at sick-leave usage in the German team over the last six months sets three filters and the page updates every tab in place. No copy-paste, no pivot table, no second tool.
Export options for board reviews and HR handoffs
A leave reporting tool also needs to leave the app. The Reports page supports two export formats.
CSV. Every tab supports CSV download for the current filter set. CSV is the format finance and payroll teams prefer because they can re-pivot it in Excel, drop it into a BI tool, or compare it against last quarter at full precision.
PDF. Utilization and country views also support a clean print layout for board decks. The PDF includes the filter context (date range, teams, countries) so the reader does not have to guess what is in scope.
If you also need to hand off approved leave to a payroll provider, the export flow lives on the dedicated bookkeeping and payroll export page rather than the Reports tab, so the two never get confused. Each payroll export keeps an audit-log reference for finance, which connects back to the same audit logging trail the rest of the app writes to.
Pro tip
Before exporting a board PDF, set the date range to match the financial period the board works in (calendar quarter, fiscal quarter, or your accrual year). The PDF prints the range in the header, which saves a slide when leadership asks what window they are looking at.
Multi-country leave reporting that excludes the right holidays
Multi-country teams break a lot of leave reports. Different statutory minimums, different public holiday counts, and different working weeks all change what a fair comparison looks like.
Each employee in BreezeLeave has a country. When the Reports page calculates utilization or average request length, it uses that country's public holiday calendar to exclude holidays from leave days. A Spanish team with 14 public holidays does not appear to take less PTO than a UK team with 8. The country tab makes the comparison explicit by sitting all countries on one table with the same definition of a working day.
For a deeper walkthrough of which insights matter for multi-country teams, see our post on utilization, coverage, and country insights in leave reports.
A monthly leave reporting routine that works
Most HR managers we hear from run a monthly review on the first business day of the month. Here is the routine the Reports page is built for:
- Set the date range to the prior month. Year-to-date is useful for the quarterly review, not the monthly one.
- Open utilization. Check whether usage is tracking close to your monthly target. If a team is far behind, plan a conversation before carryover deadlines force one.
- Switch to coverage. Look at the next four weeks. Flag concurrent absences and check the squad-level coverage for any team that already had a flag last month.
- Switch to approvals. Look at outstanding request counts and average response time per approver. Address slow approvers privately before the team notices.
- Export utilization to PDF. Use the PDF in the monthly leadership update so the board sees the same numbers you do.
The routine usually takes 20 minutes once the data is already in one place. The longer it takes, the more likely your spreadsheet is doing too much. Our checklist on running a monthly leave reporting dashboard walks through the exact owners and timestamps.
Where leave reports do not replace a conversation
The Reports page is a fast way to see what the data says. It is not a substitute for talking to a team lead when something looks unusual.
A sudden spike in sick leave for one team is a number on the chart, but the cause might be a flu wave, a deadline that needs to move, or a coverage gap that pushed people to take unscheduled time. The report tells you to ask. It does not tell you the answer.
Similarly, a low utilization number for one employee can be a sign they need a nudge to actually take their leave, but it can also be someone returning from parental leave with a legitimate reason to look light. Treat the Reports page as the input to a conversation, not the conclusion.
Frequently asked questions
Everything you might want to know before getting started. Still have questions? Reach out anytime.
Five tabs: utilization, leave trends over time, team coverage, approval patterns, and country insights. Each tab supports filters for date range, team, country, and leave type. Numbers come from the same approved-leave records you see on the calendar, so the report and the calendar agree.
Yes. Every tab supports CSV download for the current filter set. Utilization and country views also support a PDF print layout so you can drop a clean summary into a board deck, no screenshots required.
Each employee has a country. The country tab summarises requested days, average request length, and approval rate per country. Public holidays for that country are excluded from leave days, so countries with more holidays do not look artificially light on PTO usage.
Yes. Reports respect the same role permissions as the rest of the app. A team lead with scoped permissions sees coverage, utilization, and approvals for their team only. HR admins see the full company.
Utilization on the Reports page is approved leave days divided by entitled days for the filtered period. Public holidays and weekends are excluded. Pending requests are not counted until approval, so the chart reflects the actual leave taken plus what is already scheduled.
Approval patterns include rejected and cancelled requests so you can see the full request behaviour for a team. Utilization and trend tabs only count approved leave because that is what subtracts from the balance.
Reports query the same database the rest of the app uses, so they update the moment a request is approved or cancelled. There is no nightly batch job to wait on.
Pricing for leave reporting software
Reports are included on every BreezeLeave plan. There is no separate analytics add-on, no reports-only tier, and no per-report cost. Teams of up to 10 get the full Reports page on the free plan. Larger teams pay a per-person rate that covers reports, audit logs, bookkeeping export, and the rest of the app.
You can check current per-person pricing on the pricing page if you want the exact number for a team your size.
Getting started with the Reports page
If you are already a BreezeLeave customer, the Reports page is in the left navigation under Reports. Apply the four filters at the top, switch between tabs, and export with the button on the top right of each tab.
If you are new to BreezeLeave, the setup takes about 10 minutes: invite the team, set leave policies per country, import existing balances, and the Reports page starts populating as soon as the first approved request is in the system.